Flowcharts: Difference between revisions
>Mr Doom Bringer No edit summary |
>NXTBoy →Creating a flowchart: Removed LeftNoticeStart |
||
| (13 intermediate revisions by 3 users not shown) | |||
| Line 1: | Line 1: | ||
This tutorial gives you a better idea of how to think about writing your code. It's not just words on a screen, it's a line of thought. Think of your program as a line drawn on paper. That's the first step to programming, learning how to get that line to do what you want it to. | This tutorial gives you a better idea of how to think about writing your code. It's not just words on a screen, it's a line of thought. Think of your program as a line drawn on paper. That's the first step to programming, learning how to get that line to do what you want it to. | ||
=== Flowcharts, or | === Flowcharts, or code on paper === | ||
A '''Flowchart''' is what many many people use to get a clear idea of what they want their code to look like. It's a common set of symbols and designs that let you show what you want your program to do before you start writing messy code. It's kind of like creating an outline for an essay you're going to write, only a lot easier. | A '''Flowchart''' is what many many people use to get a clear idea of what they want their code to look like. It's a common set of symbols and designs that let you show what you want your program to do before you start writing messy code. It's kind of like creating an outline for an essay you're going to write, only a lot easier. | ||
'''Flowcharts''' move from a start to an end '''flow'''ing from one thing to the next in the chart. See where the name comes from? | '''Flowcharts''' move from a start to an end, '''flow'''ing from one thing to the next in the chart. See where the name comes from? | ||
Small bits of code are easy to whip right up without a flowchart. The bigger, more complex and crazier your code, the more a flowchart will make life easier for you. | Small bits of code are easy to whip right up without a flowchart. The bigger, more complex and crazier your code, the more a flowchart will make life easier for you. | ||
==Creating a | ==Creating a flowchart== | ||
{| | |||
Grab a piece of paper and a pencil, not a pen. Now draw a long straight line down the page leaving a little space at the top and some at the bottom. This is your program. Congratulations! You just wrote your first flowchart. But it's a little hard to understand. | |<imagemap>Image:Notebook.jpg|300px | ||
default [[Main Page]] | |||
desc none | |||
</imagemap> | |||
We have a start, now at the bottom of your line make another oval and put ''' | |Grab a piece of paper and a pencil, not a pen. | ||
|- | |||
Cool! You've written a basic flowchart now. But now we need to actually do something in your flowchart, we can't just go from start to stop the whole time. | |<imagemap>Image:Flowchart1.jpg|300px | ||
default [[Image:Flowchart1.jpg]] | |||
Erase some space in the middle of your line, big enough to put some words into. Now draw a slanted rectangle leaning to the right a bit, and write the words '''print("Hello Mom")''' in the middle of it. It should now look like this. | desc none | ||
</imagemap> | |||
|Now draw a long straight line down the page leaving a little space at the top and some at the bottom. This is your program. Congratulations! You just wrote your first flowchart. But it's a little hard to understand. | |||
|- | |||
Sometimes arrows are added to show which direction the flowchart is going. | |<imagemap>Image:Flowchart2.jpg|300px | ||
default [[Image:Flowchart2.jpg]] | |||
Good job. You've got a full flowchart there now. The Ovals are used to always show starts and stops. That slanted rectangle, or '''parallelogram''' is called an output. The '''print''' command spits out text, in this case it prints out ''Hello Mom''. | desc none | ||
</imagemap> | |||
|Let's make it easier to read. At the top create an oval, and in the oval put '''Start'''. This is the beginning of your flowchart, and now it's really easy to see where your flowchart starts. Nice how that works, eh? | |||
|- | |||
|<imagemap>Image:Flowchart3.jpg|300px | |||
default [[Image:Flowchart3.jpg]] | |||
desc none | |||
</imagemap> | |||
|We have a start, now at the bottom of your line make another oval and put '''Stop''' in it. This is the end of your flowchart. Flowcharts always go from Start to Stop. Cool! You've written a basic flowchart now. But now we need to actually do something in your flowchart, we can't just go from start to stop the whole time. | |||
|- | |||
|<imagemap>Image:Flowchart4.jpg|300px | |||
default [[Image:Flowchart4.jpg]] | |||
desc none | |||
</imagemap> | |||
|Erase some space in the middle of your line, big enough to put some words into. Now draw a slanted rectangle leaning to the right a bit, and write the words '''print("Hello Mom")''' in the middle of it. It should now look like this. Sometimes arrows are added to show which direction the flowchart is going. | |||
|- | |||
|<imagemap>Image:Flowchart5.jpg|300px | |||
default [[Image:Flowchart5.jpg]] | |||
desc none | |||
</imagemap> | |||
|Good job. You've got a full flowchart there now. The Ovals are used to always show starts and stops. That slanted rectangle, or '''parallelogram''' is called an output. The '''print''' command spits out text, in this case it prints out ''Hello Mom''. | |||
There are a bunch of other symbols that are used in flowcharts, such as | There are a bunch of other symbols that are used in flowcharts, such as | ||
*Input/Output is represented as a parallelogram. | *Input/Output is represented as a parallelogram. | ||
*Processing steps are represented as rectangles. | *Processing steps are represented as rectangles. | ||
*[[Conditional statements]] are represented as a diamond. These typically contain a Yes/No question or True/False test. | |||
*[[Conditional statements]] are represented as a diamond. These typically contain a Yes/No question or True/False test. | |} | ||
[[Category:Scripting Tutorials]] | [[Category:Scripting Tutorials]] | ||
Latest revision as of 17:33, 16 April 2012
This tutorial gives you a better idea of how to think about writing your code. It's not just words on a screen, it's a line of thought. Think of your program as a line drawn on paper. That's the first step to programming, learning how to get that line to do what you want it to.
Flowcharts, or code on paper
A Flowchart is what many many people use to get a clear idea of what they want their code to look like. It's a common set of symbols and designs that let you show what you want your program to do before you start writing messy code. It's kind of like creating an outline for an essay you're going to write, only a lot easier.
Flowcharts move from a start to an end, flowing from one thing to the next in the chart. See where the name comes from?
Small bits of code are easy to whip right up without a flowchart. The bigger, more complex and crazier your code, the more a flowchart will make life easier for you.
Creating a flowchart
Error: Image is invalid or non-existent. |
Grab a piece of paper and a pencil, not a pen. |
 |
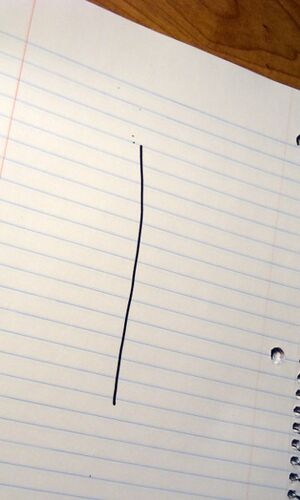
Now draw a long straight line down the page leaving a little space at the top and some at the bottom. This is your program. Congratulations! You just wrote your first flowchart. But it's a little hard to understand. |
 |
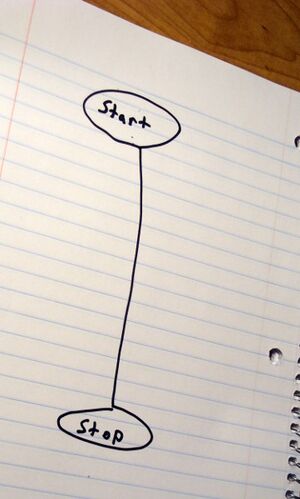
Let's make it easier to read. At the top create an oval, and in the oval put Start. This is the beginning of your flowchart, and now it's really easy to see where your flowchart starts. Nice how that works, eh? |
 |
We have a start, now at the bottom of your line make another oval and put Stop in it. This is the end of your flowchart. Flowcharts always go from Start to Stop. Cool! You've written a basic flowchart now. But now we need to actually do something in your flowchart, we can't just go from start to stop the whole time. |
 |
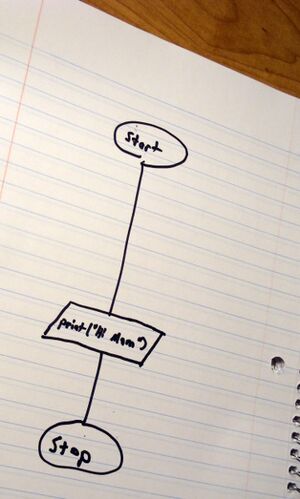
Erase some space in the middle of your line, big enough to put some words into. Now draw a slanted rectangle leaning to the right a bit, and write the words print("Hello Mom") in the middle of it. It should now look like this. Sometimes arrows are added to show which direction the flowchart is going. |
 |
Good job. You've got a full flowchart there now. The Ovals are used to always show starts and stops. That slanted rectangle, or parallelogram is called an output. The print command spits out text, in this case it prints out Hello Mom.
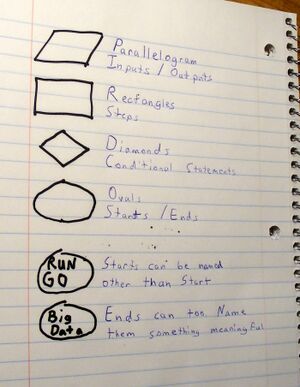
There are a bunch of other symbols that are used in flowcharts, such as
|